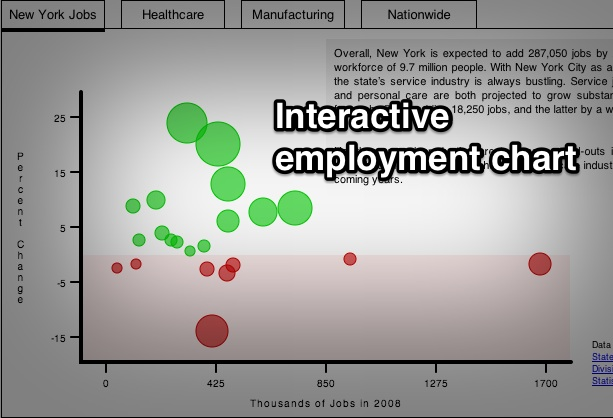
With a classmate, I explored the future of employment in New York and across the U.S. by building an interactive “bubble chart” visualization that points to a boom for some industries, and ruin for others. The interactive was featured on the school’s NYCity News Service.